
L2D Automated System + Fractal Level Indicator
The Fractal Level Indicator marks the levels where a structure is likely to begin. The L2D Automated System takes it from there: it reads the context, scales the copy, and plots the resulting entry, take profit and invalidation. You review the reading and decide.
Two tools, one blueprint.
Both indicators are included in every plan, at no extra cost. Each works on its own. Together they cover the whole process, from where to look to where the projection ends.
Fractal Level Indicator
Scans price with fixed, rule-based criteria and marks the levels where a structure has a statistically elevated tendency to originate: the exact point to anchor from, the range to study, and the timeframe the structure lives on. It answers the first question before any interpretation begins: where do you even start?
L2D Automated System
Runs the full three-layer blueprint automatically: it locates the fractal by rule, reads the context, scales the copy, and plots the projected entry, take profit and invalidation. The reading is returned to you. The decision stays yours.
Use the Fractal Level Indicator to study structure by hand, the L2D to see the full reading automatically, or both side by side to check one against the other.
Move the starting point —
and you get a different fractal.
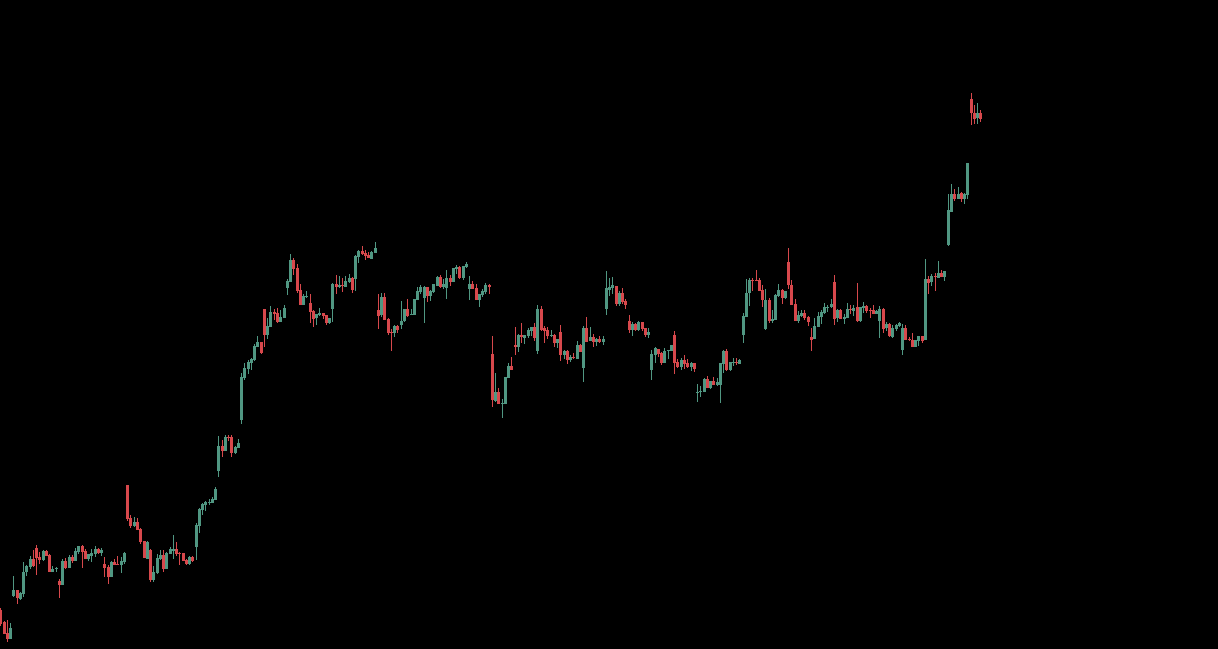
On a raw chart the hardest question comes first: from which low, from which high, on which timeframe? Shift the starting point and the same chart yields a different “fractal” — proof the pattern lived in the choice, not in the price. A method that measures before fixing its reference frame can be argued into saying anything.
The blueprint fixes the frame first, then measures: the level by rule, the context, the scaled copy. L2D runs those three layers on your chart automatically — the work the analyst would otherwise do by hand — and returns one reading: entry, take profit, invalidation. The tool proposes the reading; the analyst decides.
Three layers, applied by hand —
now read automatically.
What follows is the full framework as it was taught, layer by layer. The Fractal Level Indicator gives you Layer 1 on any chart. The L2D Automated System runs the whole process: it defines the valid fractal, scales the copy, and plots the projected entry, take profit and invalidation.
Nature keeps repeating itself —
and so does price.
The mathematician Benoit Mandelbrot noticed that the things in nature we call “rough” or random — coastlines, clouds, trees, the branching of rivers and blood vessels — were actually built on one repeating principle: the same shape reappears at different scales. Zoom into a coastline and a small bay looks like the whole coast. He called this self-similarity, and the geometry that describes it fractal geometry.
Strip the labels off a one-day chart and a one-decade chart, and you can barely tell them apart.
Then Mandelbrot turned to markets. Studying price data, he found the same fingerprint. Price wasn’t smooth, and it wasn’t purely random — it was fractal. The same structures repeat across the 1-minute, the 1-hour, and the weekly. That single idea is the foundation everything else here is built on.
If structure repeats across scales, then a method that reads structure correctly should work on any timeframe — the chart just changes size, not shape.
“Markets are fractal” is old news. Trading them precisely is not.
Put ten traders in front of the same chart and you’ll get ten different reads. Most fractal trading comes down to eyeballing a shape, calling it a pattern, and hoping the next one behaves like the last. It’s subjective — an opinion with extra steps.
Does this look like a fractal?
Subjective. Depends on who’s looking, their mood, and what they want to see. Impossible to test, hard to repeat.
What must be true to call it one?
We wrote the exact conditions down as rules and stacked them in layers. A structure only qualifies when every layer confirms.
The result is a blueprint, not a hunch. Same chart, same rules, same read — objective, repeatable, and testable. We’re not asking the market to be predictable. We’re asking ourselves to be consistent.
Like building codes for price.
A single beam tells you nothing about whether a house will stand. A set of layered checks, each verified in order, tells you the structure is sound. Each layer answers one precise question — and passing on a bad setup is worth as much as taking a good one.
Localization — where to begin
The exact point, range, and timeframe to study, fixed objectively by the Fractal Level System.
Context — which way it is biased
Reading the market by mapping both scenarios — continuation or exhaustion — from the same origin.
Projection — where it is projected to reach
Copying the structure and checking self-similarity to map the path the market is expected to travel.
Together, the three layers resolve into a single mechanical entry and take profit — walked through at the end on one live example.
Where do you
even begin?
On a raw chart the hardest question comes first: from which low, from which high, on which timeframe? Move the starting point and you get a different “fractal” — proof the pattern lived in your choices, not in the chart. Science settled this long ago: you fix your region of interest and reference frame before you measure, or you can slide the boundaries until the data says whatever you want. A method is only objective if it locks the starting conditions first.
That is what the Fractal Level Indicator does — and it is included in your plan. It scans price with fixed, rule-based criteria and marks the levels where a structure has a statistically elevated tendency to originate — giving you the exact point to anchor from and the precise range to study, before any interpretation begins.
Which way
is it biased?
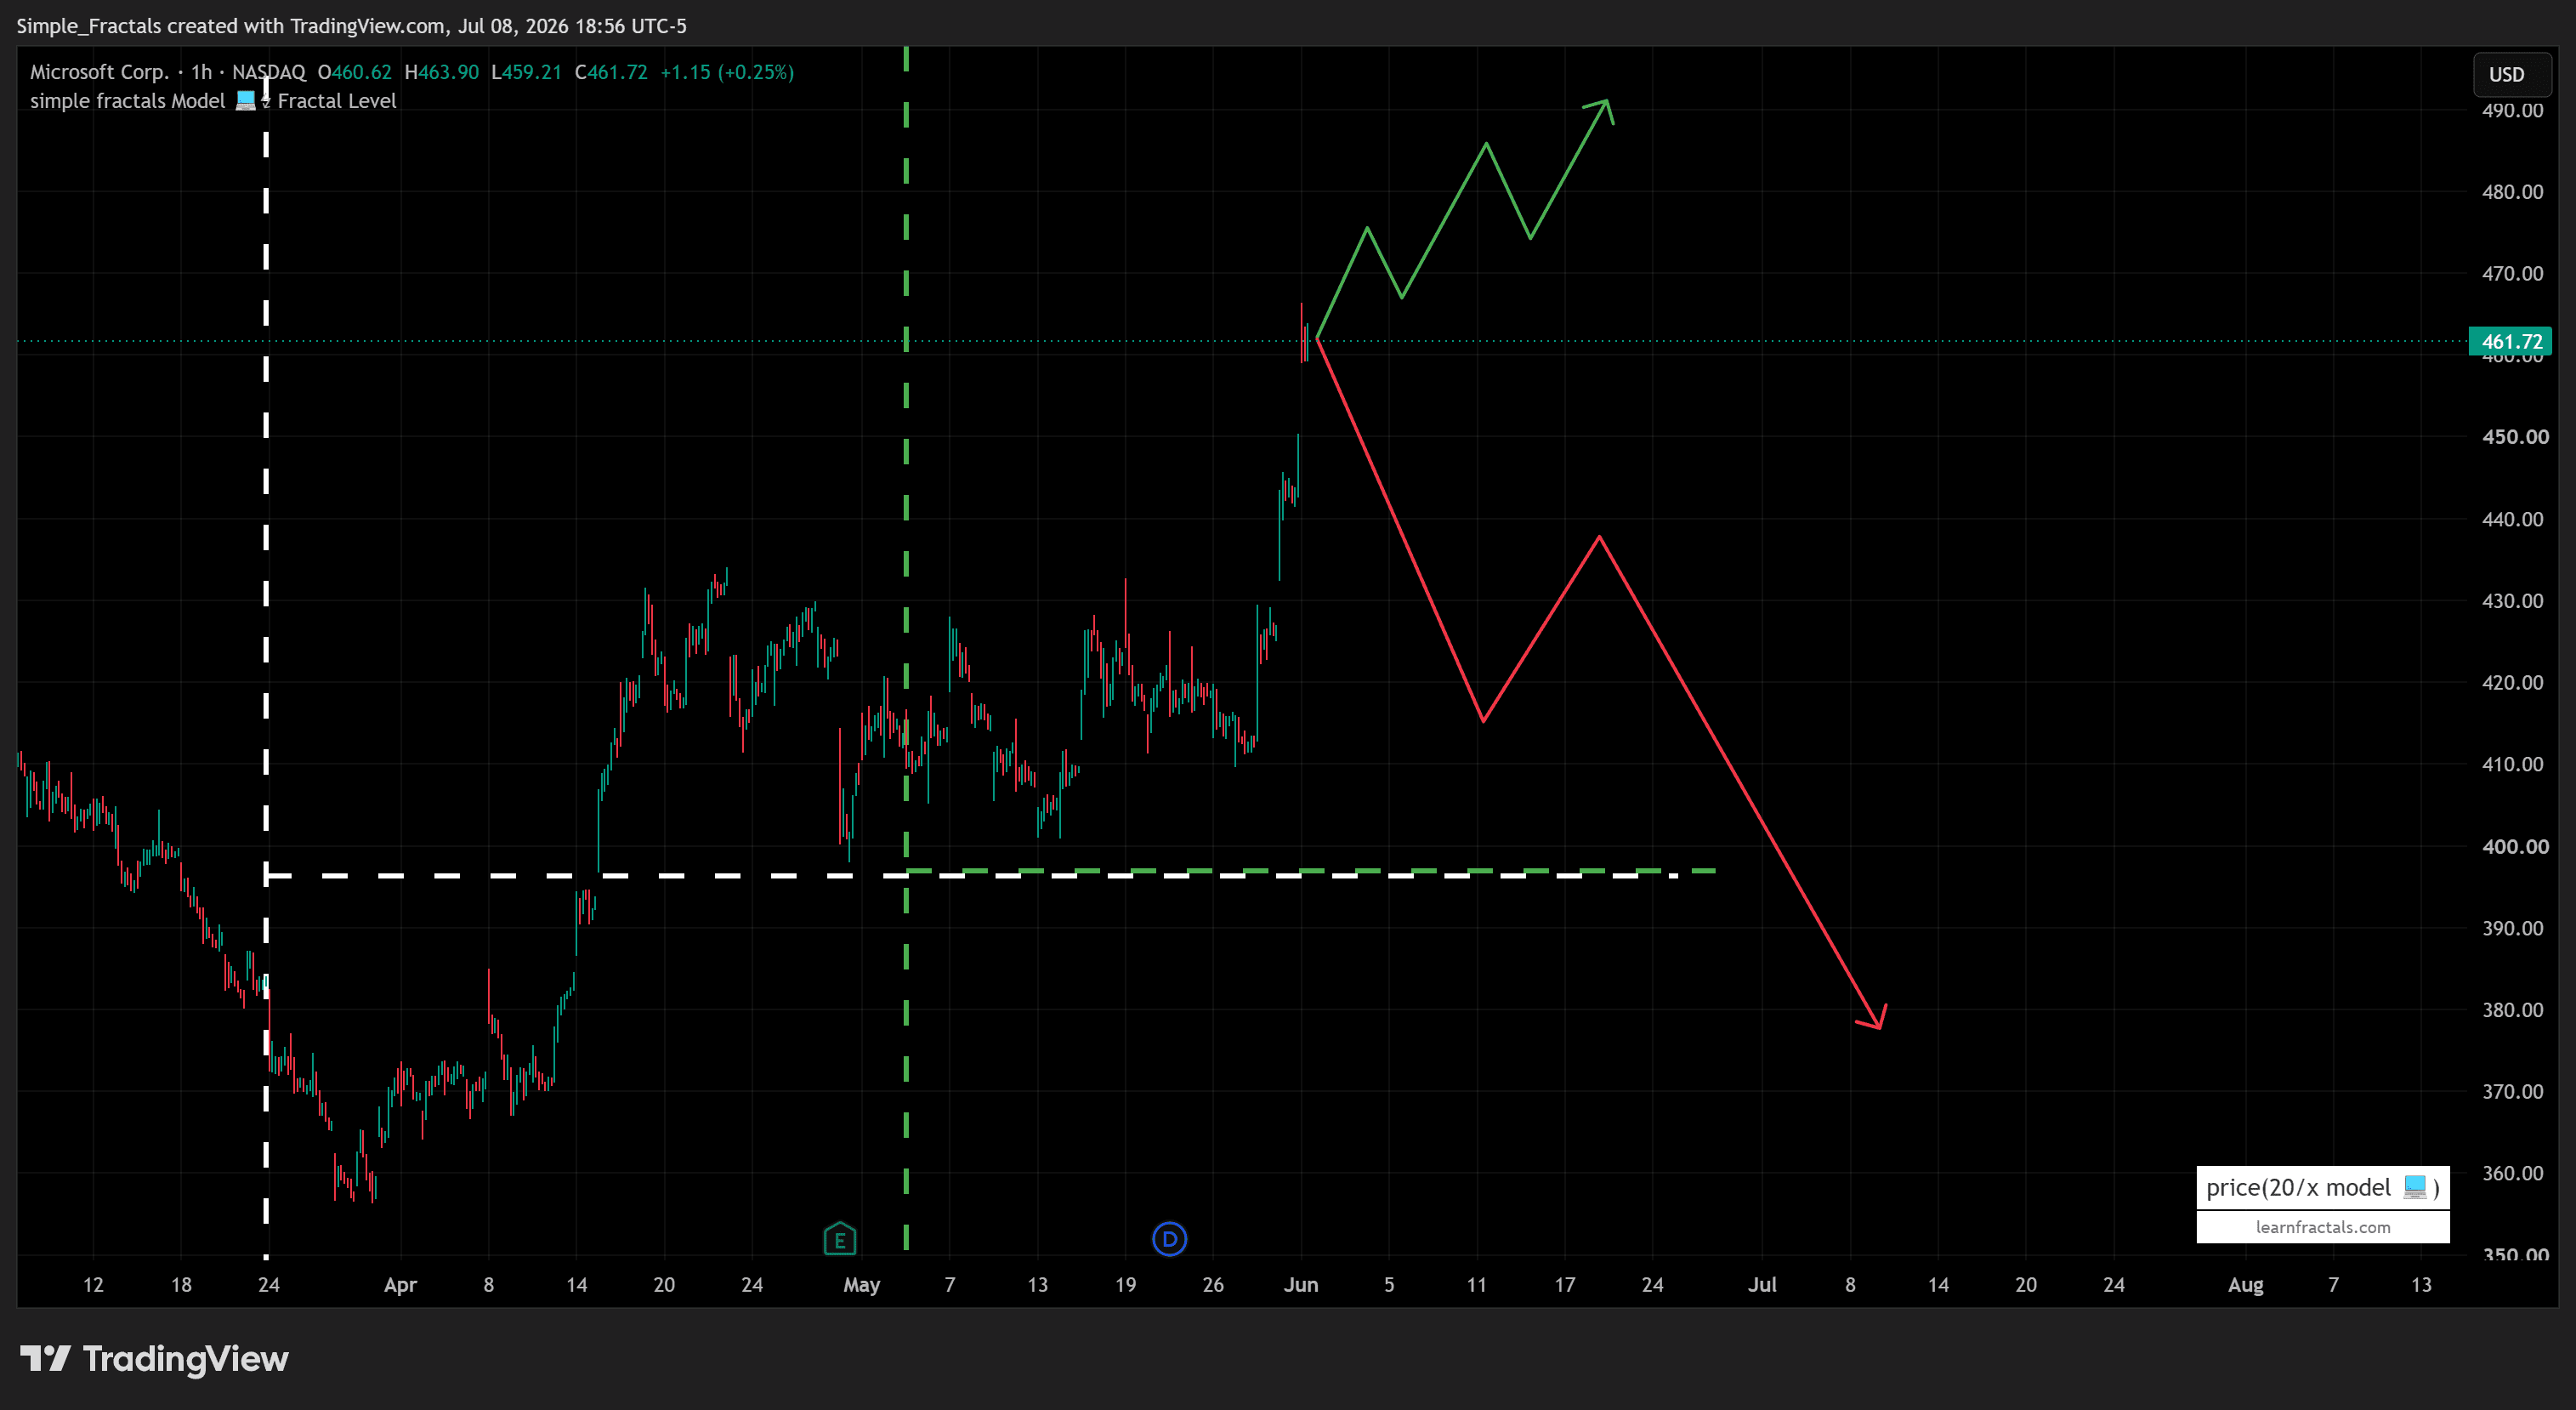
Once Layer 1 has fixed where to look, Layer 2 asks the market a direct question: which side is in control? From the confirmed level, price has two honest ways forward — buyers keep stacking longs and the market prints higher highs, or buyers are exhausted and price rolls over to take the previous lows. Reading the context means holding both at once: not guessing which happens, but knowing exactly what each one would look like.
This is what separates a plan from a prediction. We don’t fall in love with a direction. We map the bullish and bearish paths from the same origin, define what would confirm each, and let price tell us which one it is committing to.
Where is it
projected to reach?
With the context read, we take a clean copy of the confirmed structure with TradingView's Bars Pattern tool and overlay it onto the move in progress — then check whether the two are self-similar: the same geometry repeating at a larger scale.
If they match, the part of the fractal that hasn’t completed yet maps the path we anticipate. That unfinished section is the scenario we prepare to trade — a projected route, not a promise.
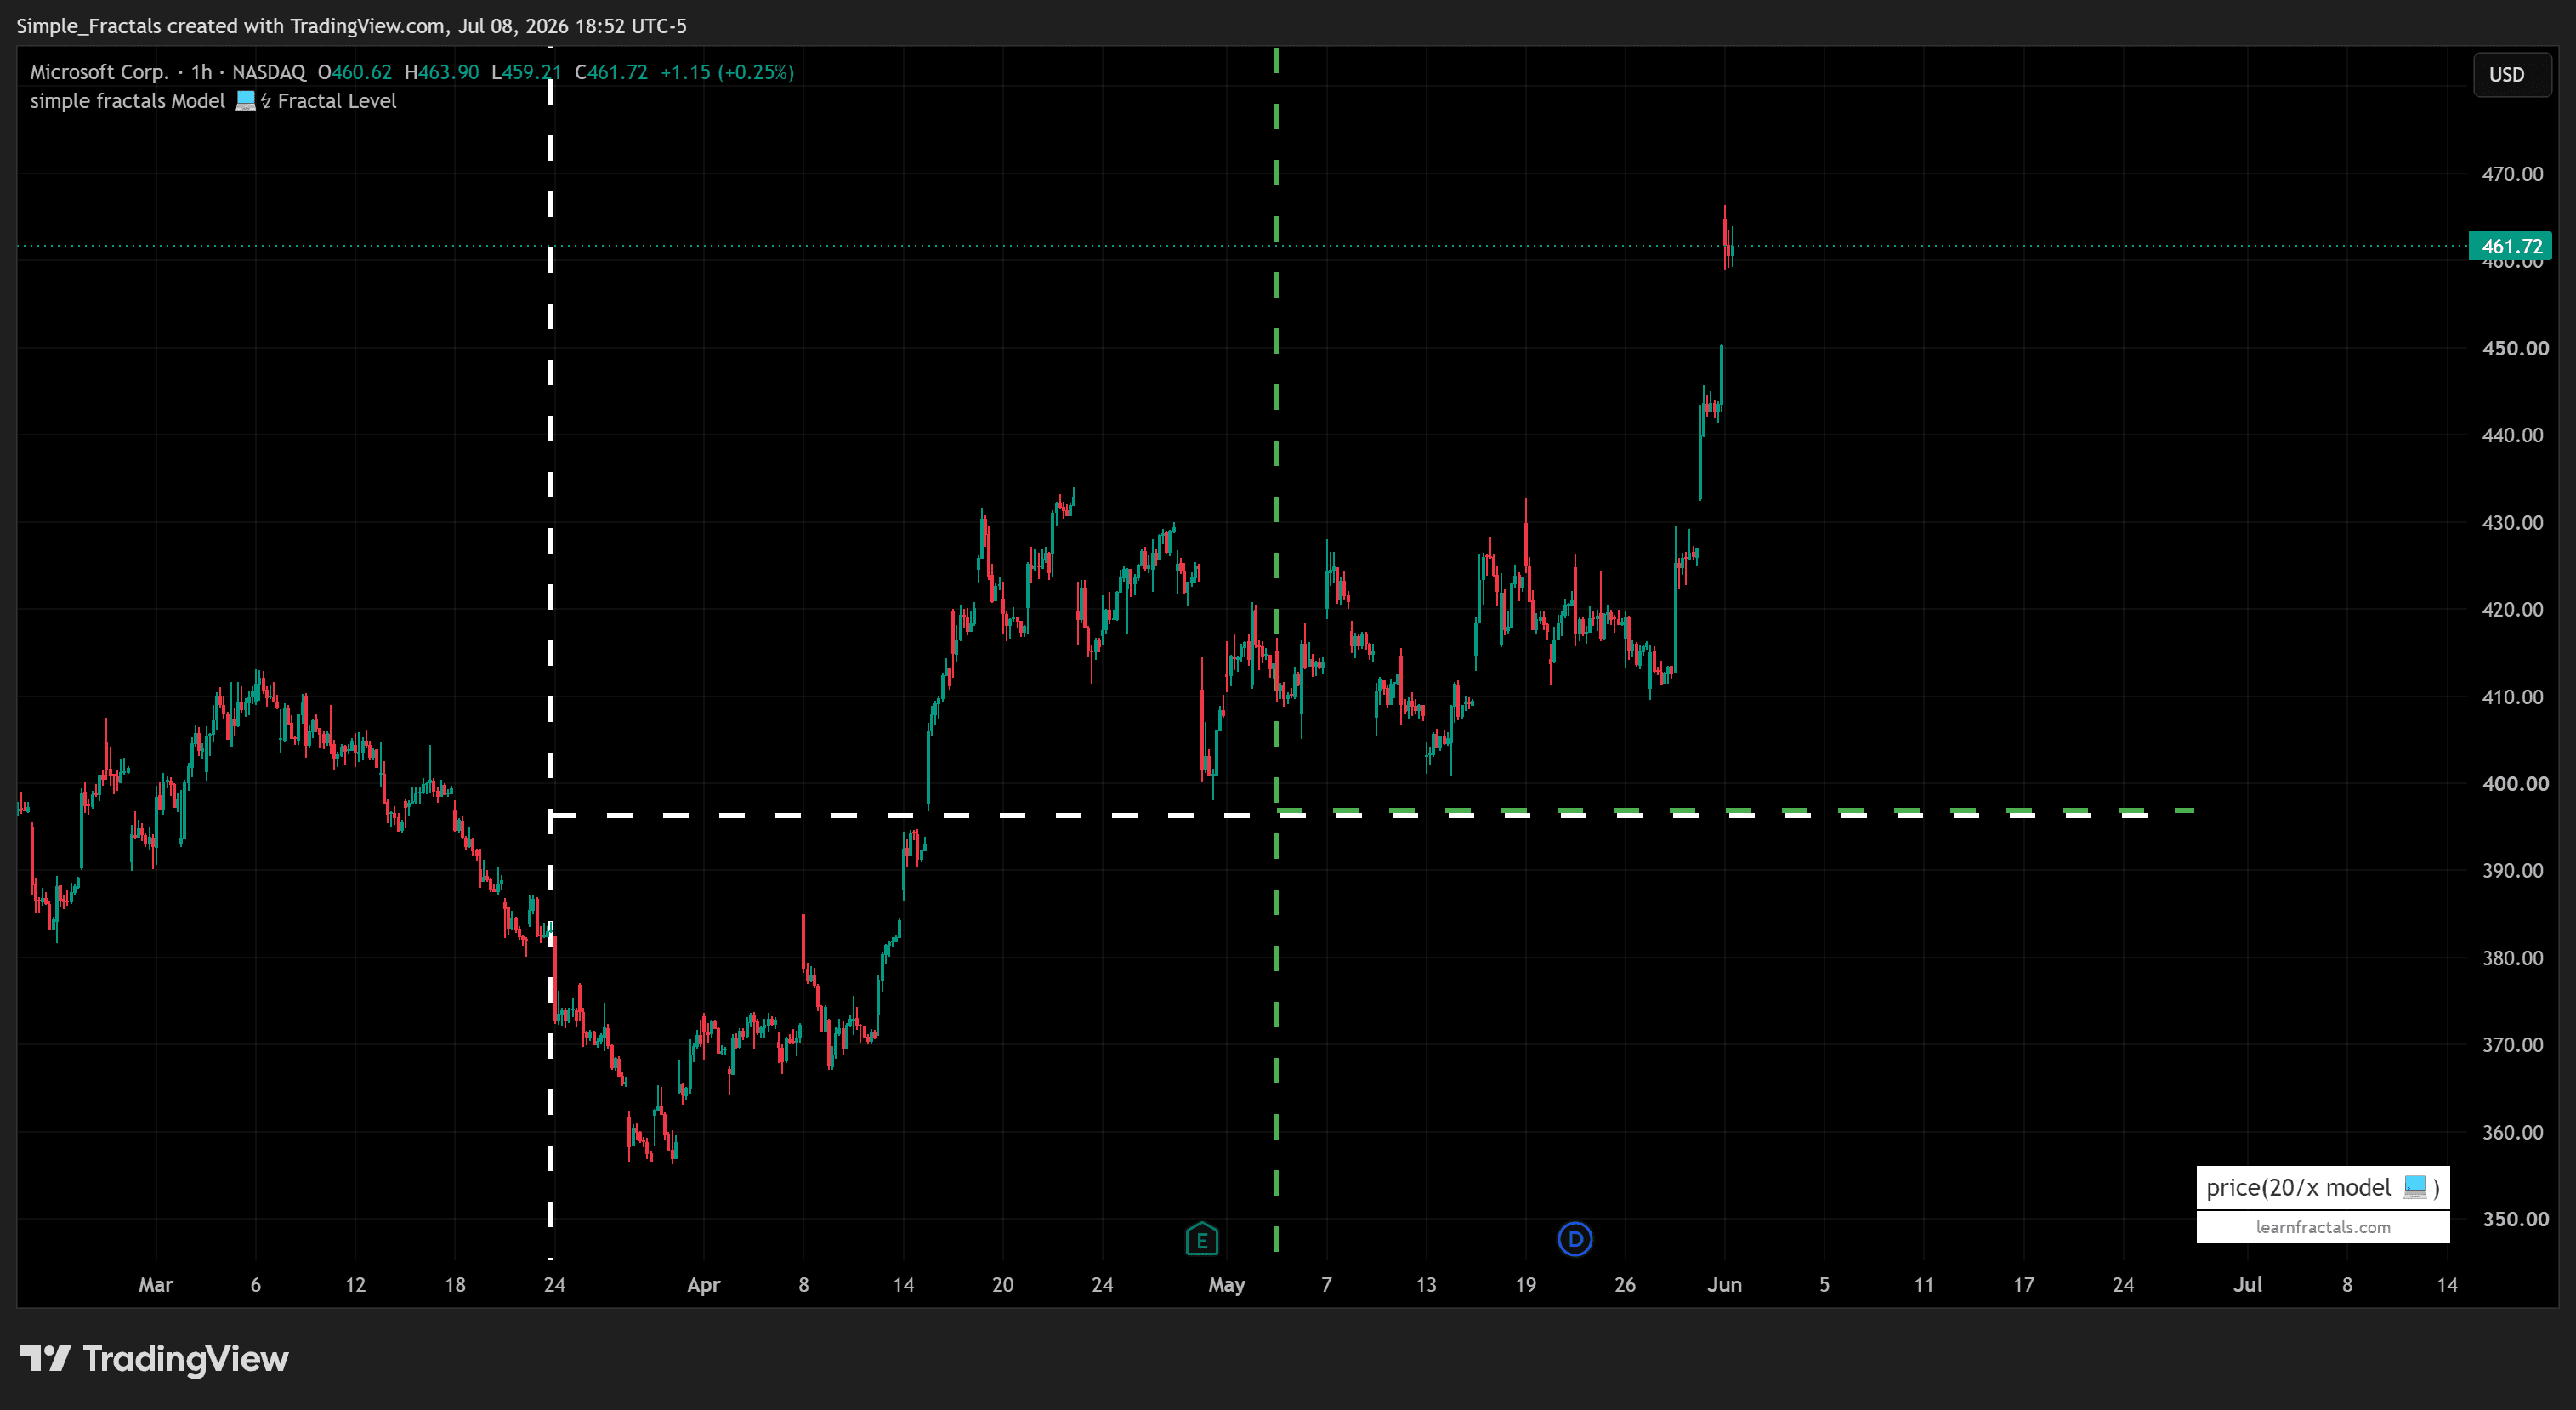
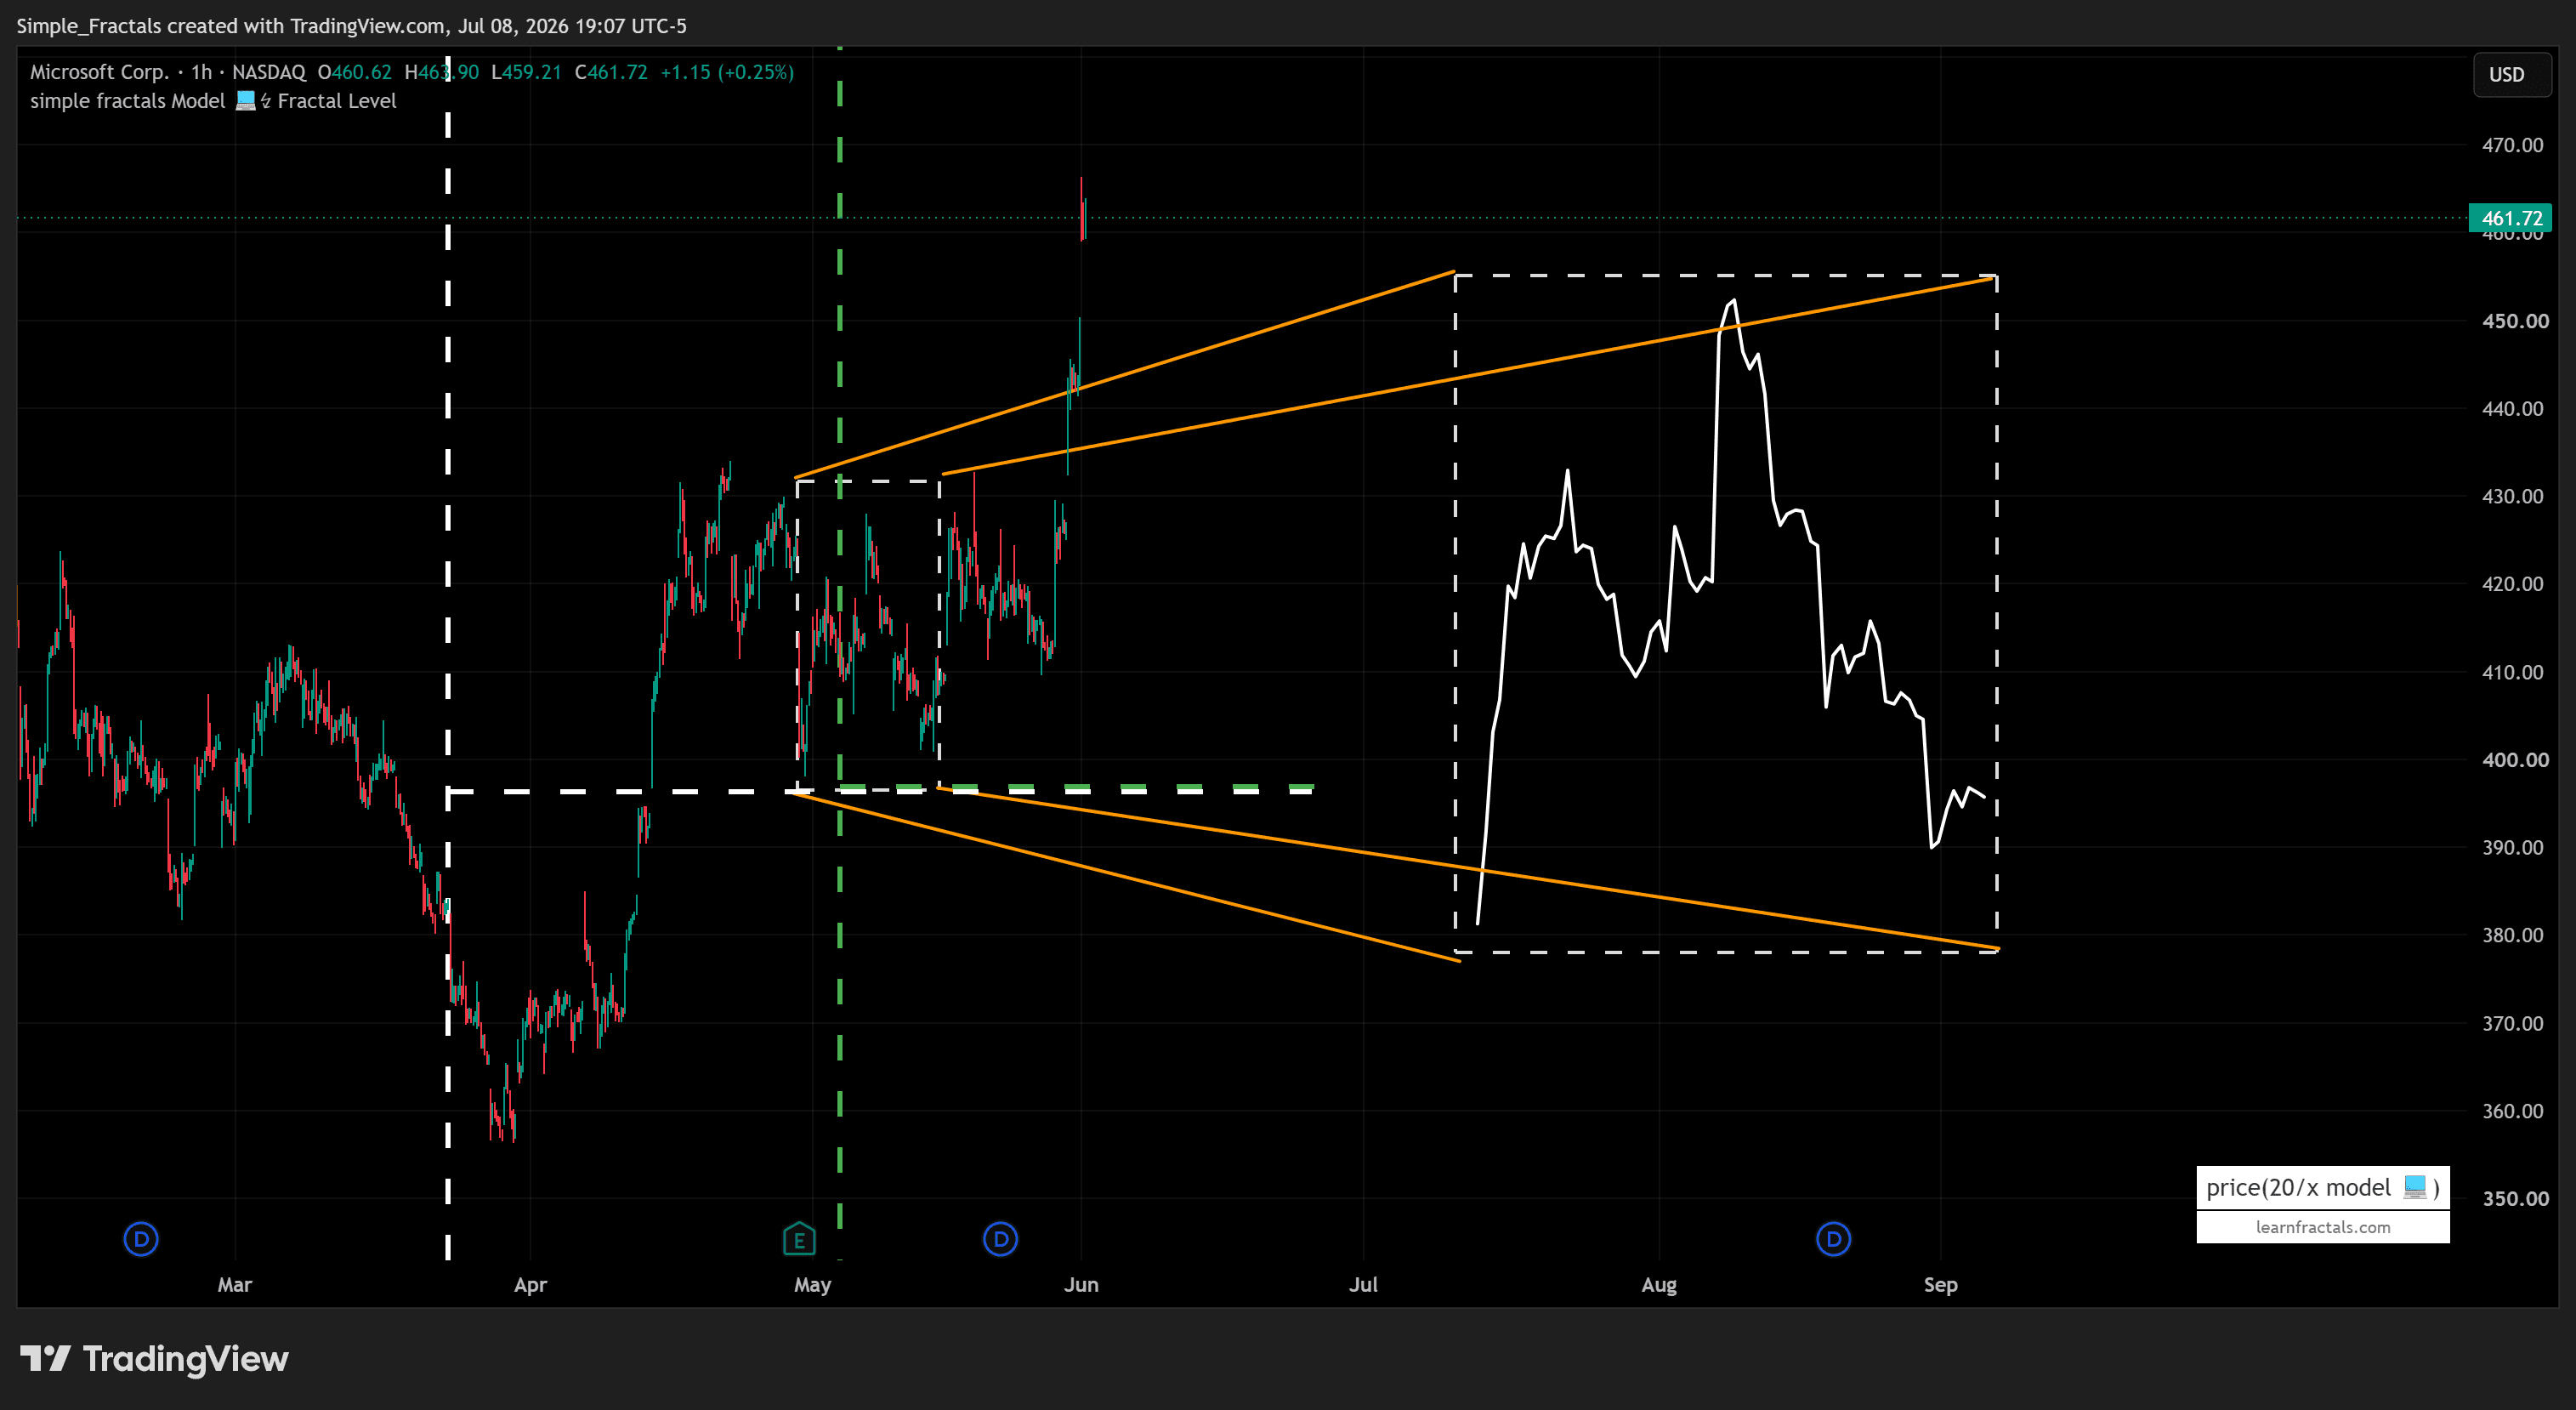
Microsoft · 1H. The Fractal Level plots the origin and its confirmation, and projects the level forward — defining exactly where the study begins and which range is in scope. Everything to the left is out of scope. Illustrative example only, not a recommendation; potential scenario, not a guaranteed outcome.
Entry and target — read off, not guessed.
The final step is mechanical. We scale the confirmed copy and fix its anchor points onto the live structure. Nothing here is discretionary — the anchors lock it in place, and the copy does the rest.
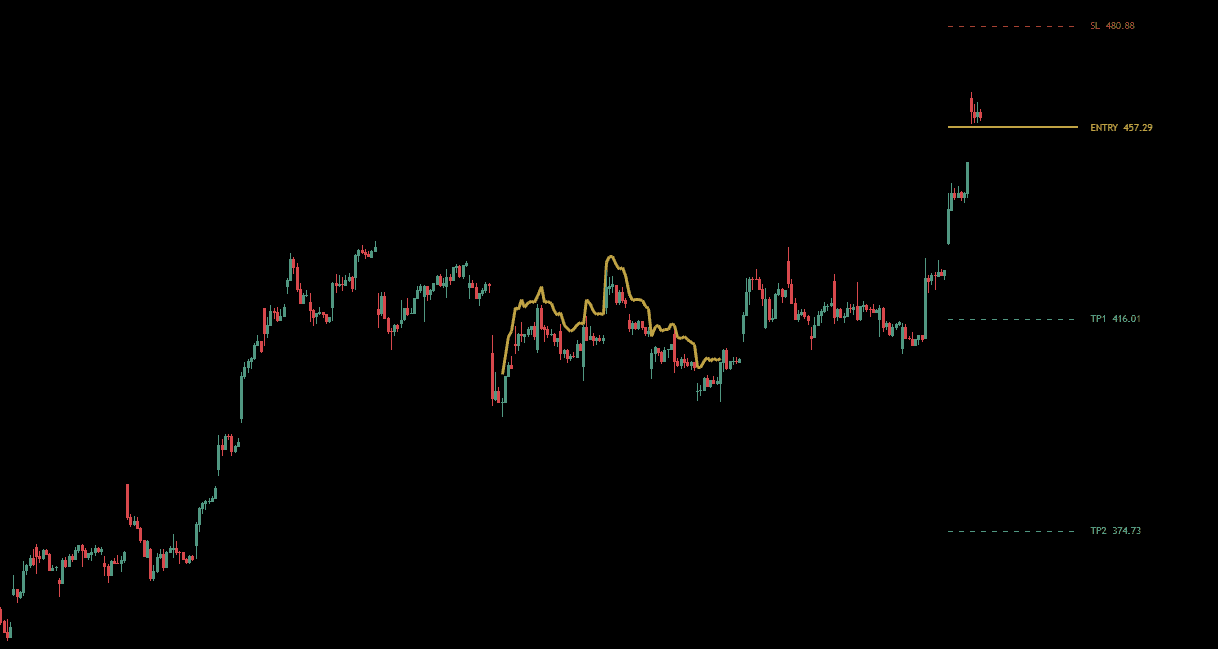
From that scaled copy, the entry is a precise level — not a zone you feel your way into — and the take profit is simply where the projection ends. The plan is complete before the trade is ever open.
The exact level fixed by the scaled copy’s anchor — one price, not a guess.
The end of the projection — the target is defined before you enter.
Bounded above — if price breaks it, the scenario is wrong and you are out.
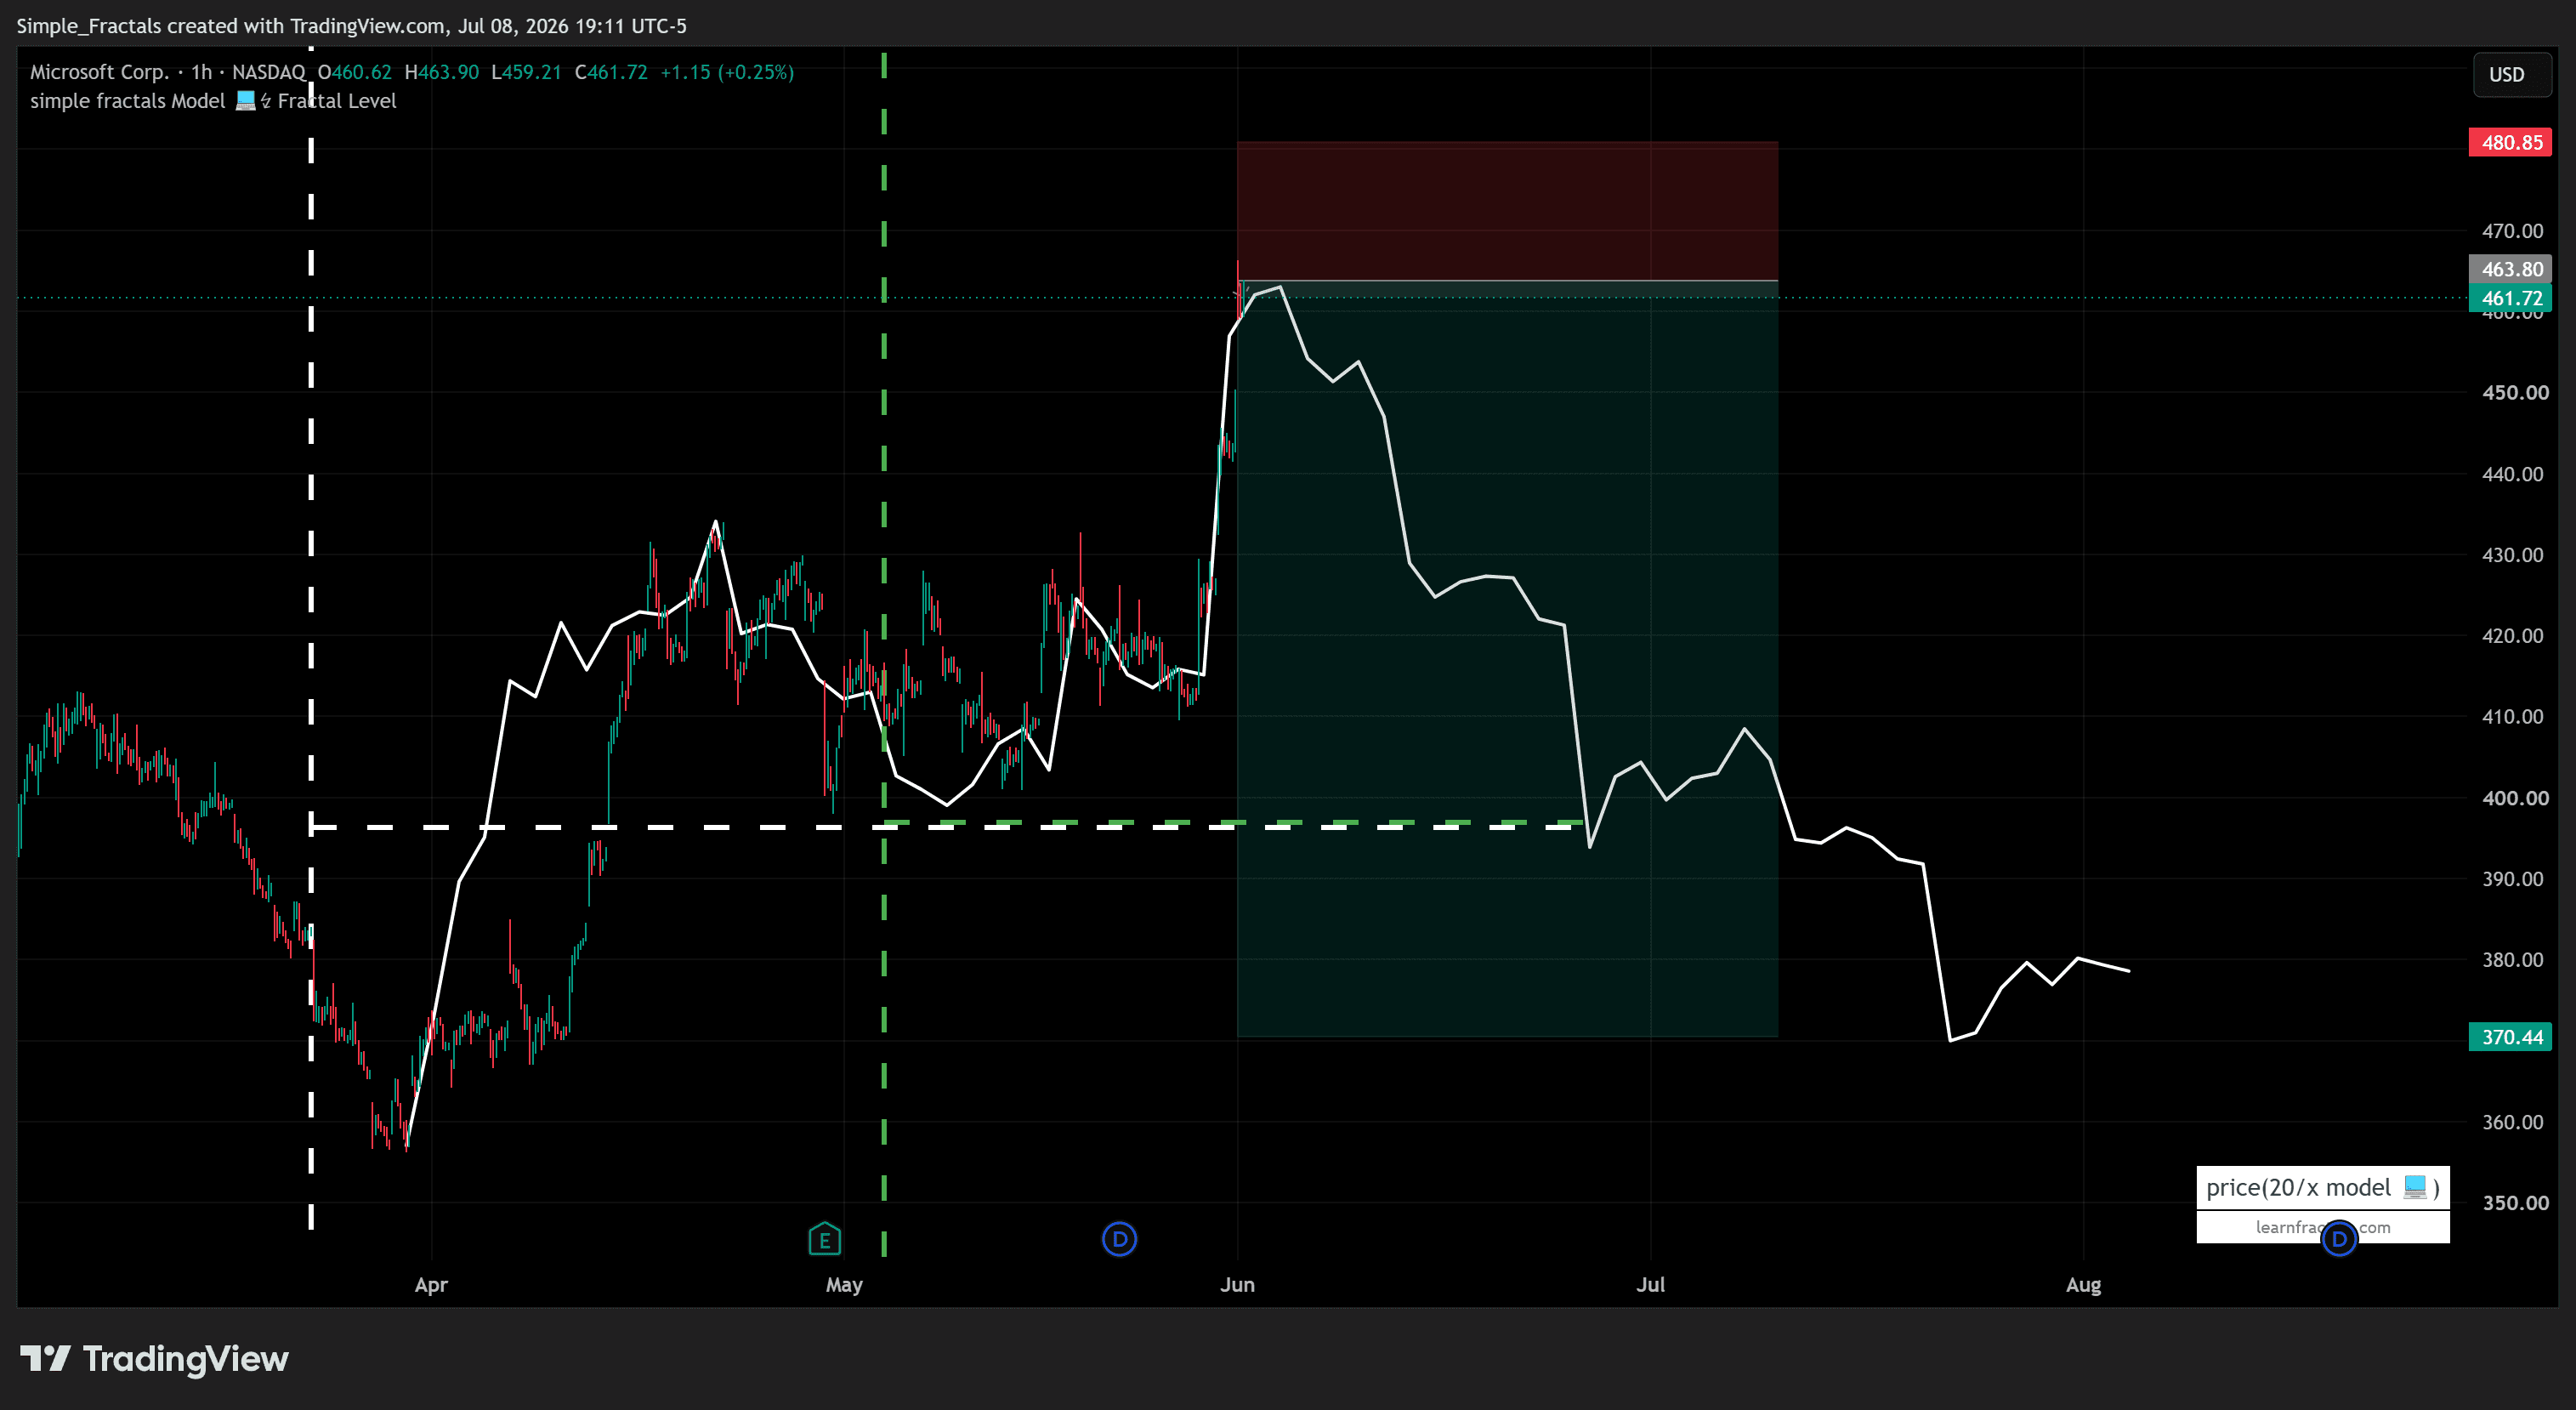
Microsoft · 1H. Every level is read off the scaled copy — entry at the anchor, take profit at the projection’s end, invalidation bounded above. Illustrative example only — not a signal or entry/exit recommendation; potential scenario, not a guaranteed outcome. Trading involves substantial risk of loss.
The plan needed no adjustment.
This is the same setup, left to play out. Price followed the projected copy down into the target and reached the take profit that was defined before entry — no level moved, no target redrawn. That is the point of the blueprint: the work is done before the trade, so the trade itself is only management. The market either respects the structure or invalidates it — and either way, the decision was made in advance.
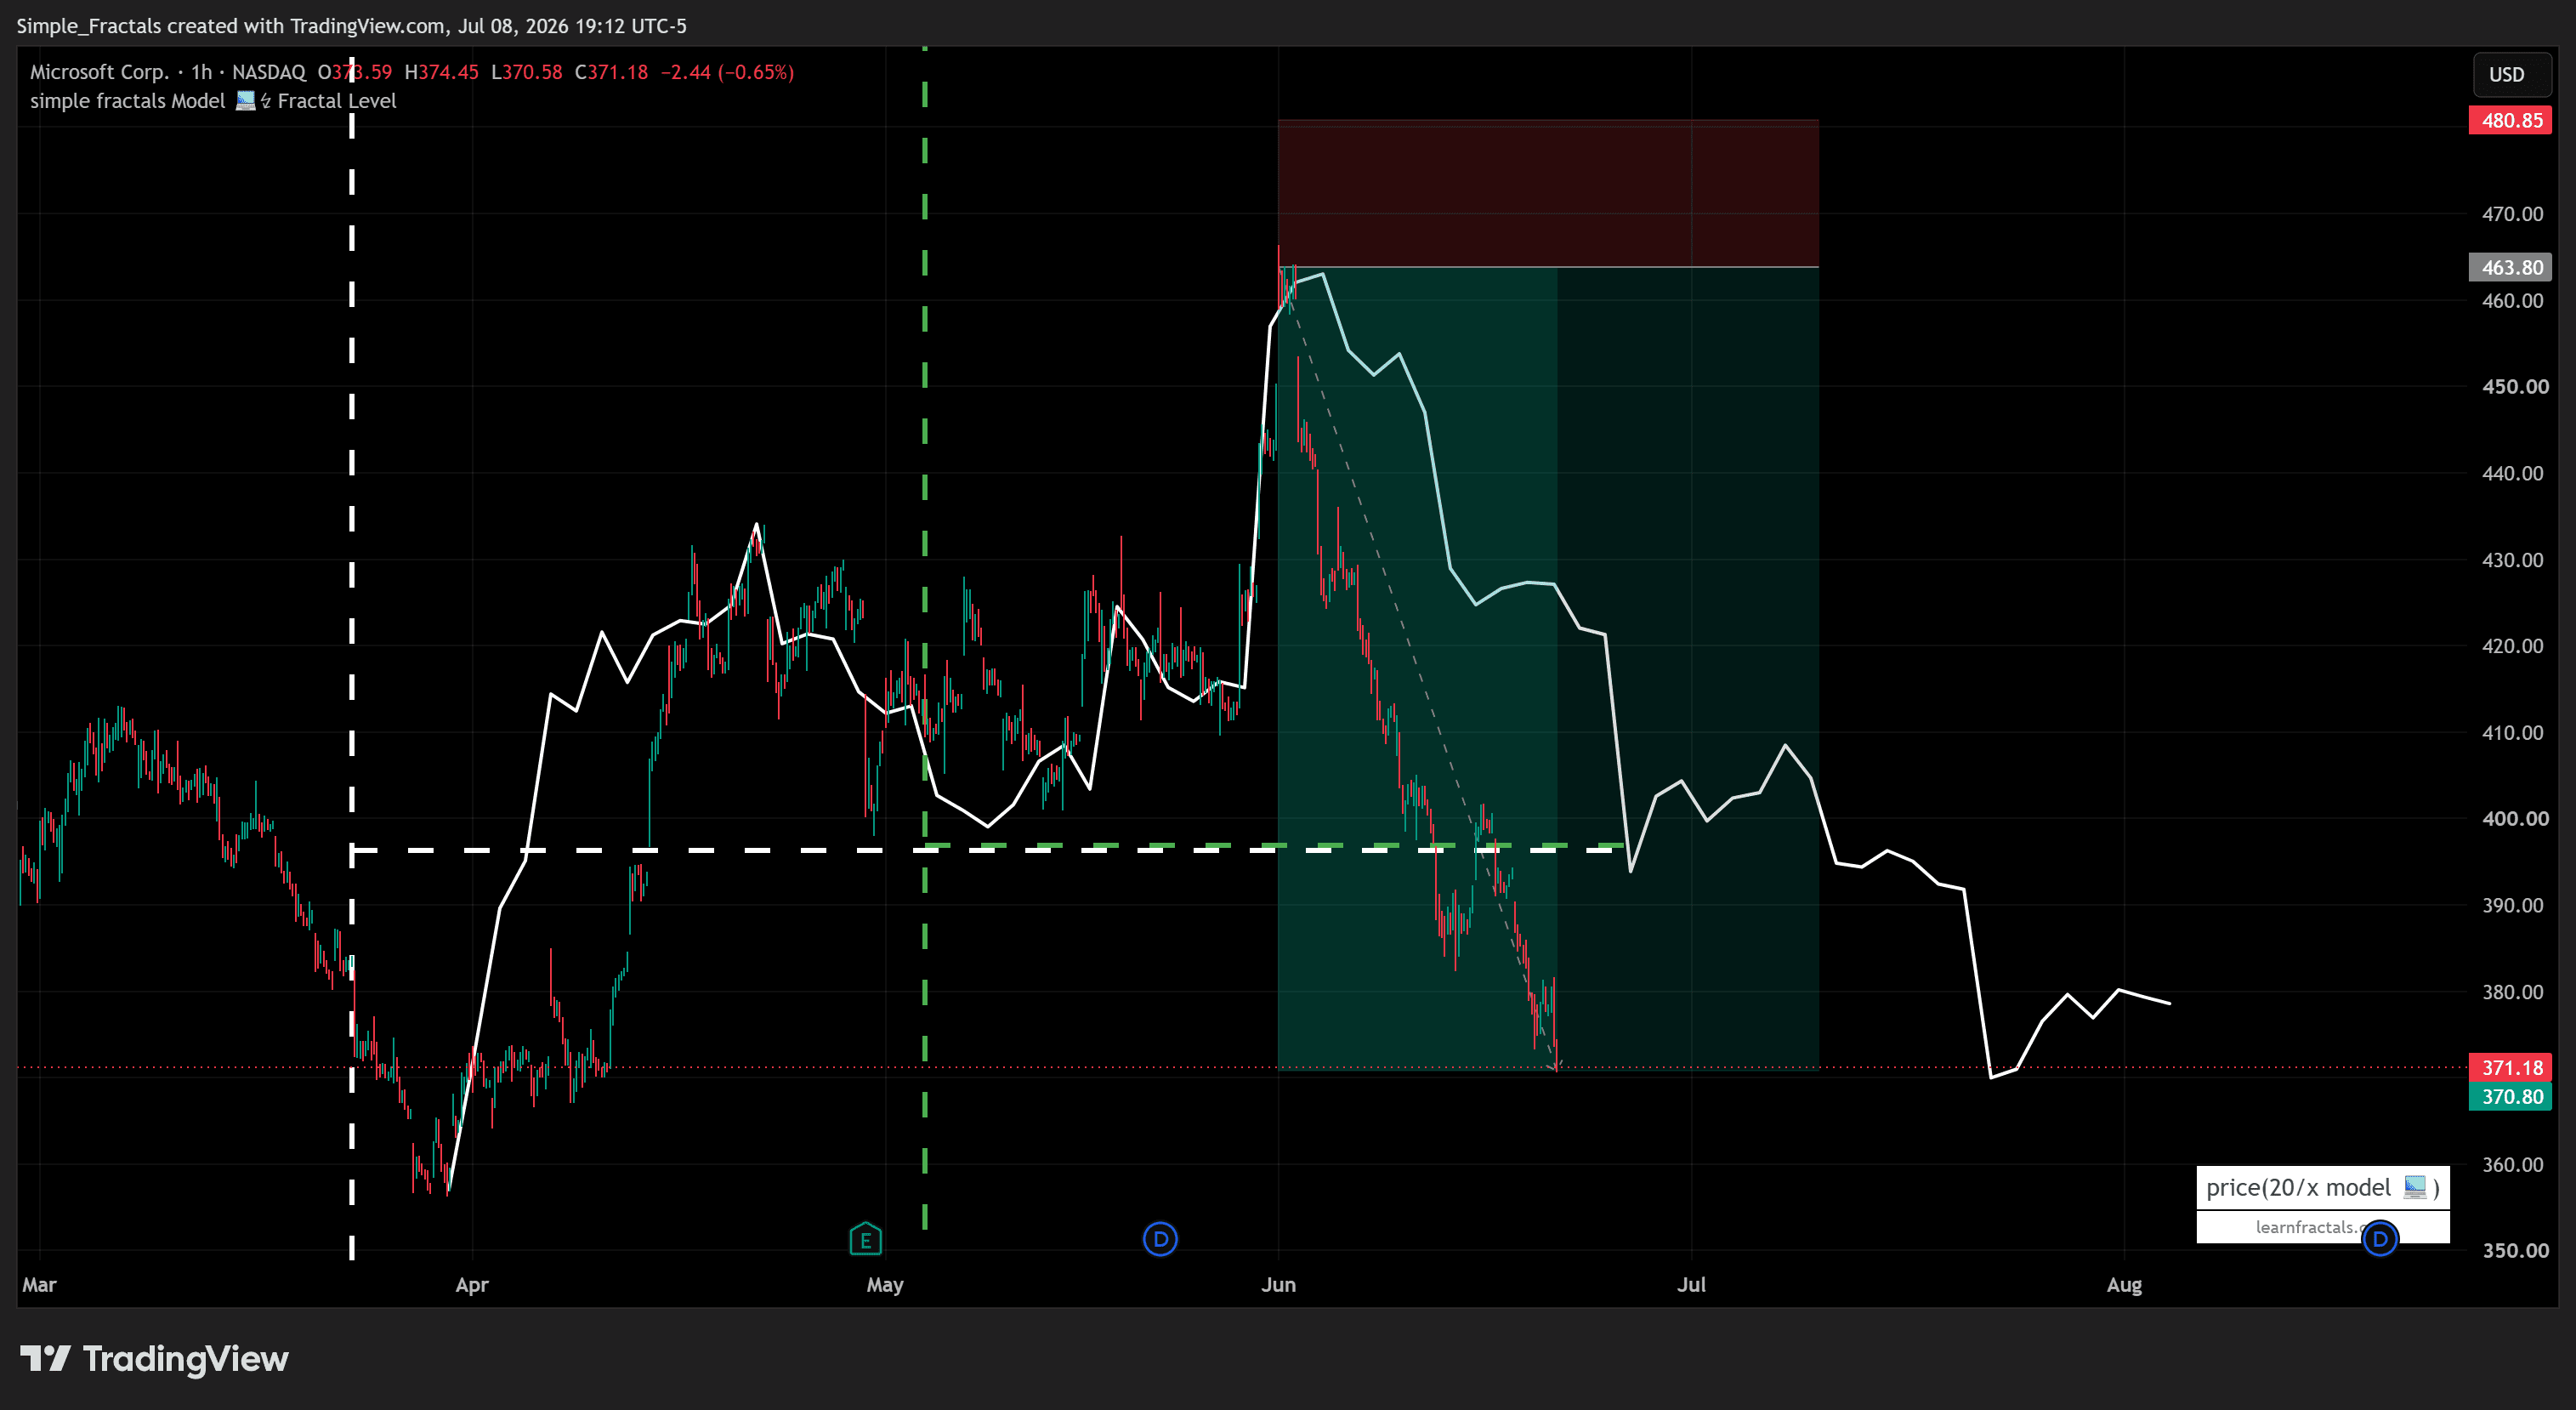
Microsoft · 1H. The dashed line is the projected copy; price tracked it into the take-profit level set in advance. This is a single historical illustration of the process, chosen to show how the layers fit together.
Structure first
Every read starts from a level fixed by rule, not from a hunch about direction. If the starting conditions are not locked, nothing built on them is testable.
Classification, not prediction
The blueprint names what the structure is, what would invalidate it, and the path the projection anticipates. A projection is a scenario read from the structure — not a claim to know where price will go.
Your decision, always
The method gives you a framework for reading structure. Position sizing, risk, and whether to act at all remain entirely yours.
Choose your term.
Every plan includes both indicators: L2D Automated System + Fractal Level Indicator.
Both indicators, complete.
Both indicators, plus the material to master them.
The full programme, with direct access.